
Do you want to sift through endless graphs and lists, or drill through screen after screen of data? Most of us just want simple web analytics that work. What features should you look for? Read on for the top 4 pillars of simple web analytics!
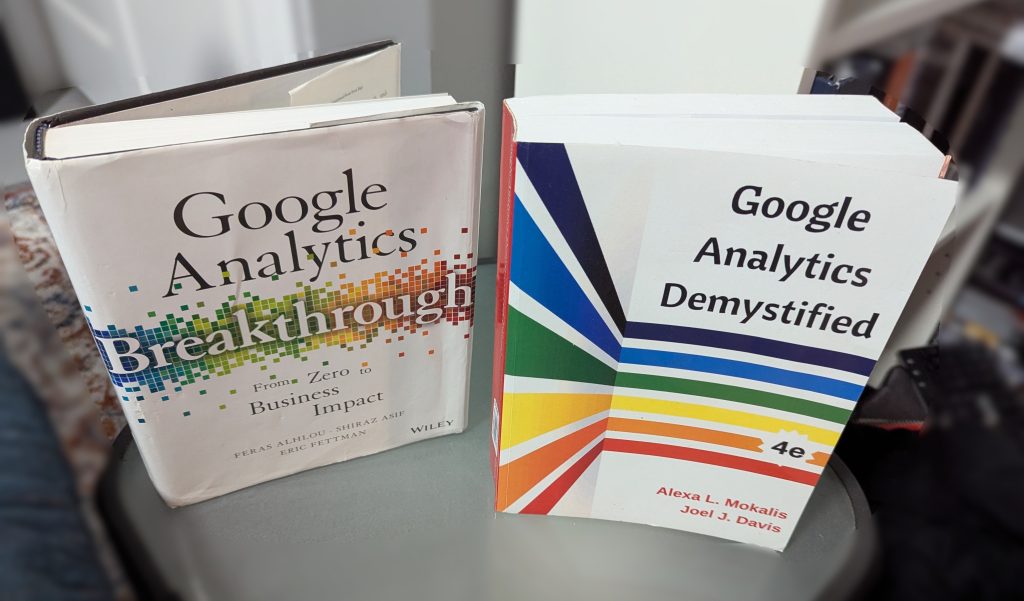
Google Analytics is probably the first service you’ll find for web analytics — it’s free and very powerful. But it’s not easy or simple. In fact, there are books with 500-700 pages that explain how to use the service and interpret the data (see image below)! Or, you could hire a consulting team to help you learn. There are even full-length articles just to help you migrate from the old version of Google Analytics (Universal Analytics) to the latest version, GA4.
If you’re a marketer, you need to have all the data and graphs possible to understand your data. And for those who have the time to learn a new tool, then Google Analytics might be great to learn. But for those of us who have plenty on our plate already, we need something that is easy to get up to speed with and doesn’t take a degree in marketing to understand. Luckily there are many “Google Alternatives” available that try to address one problem or another that plagues Google Analytics. Most will claim to be easy to understand, easy to set up, and consider privacy first. But what are the core features or pillars you should look for in a “simple” service?
First Pillar of Simple Web Analytics: Implementation
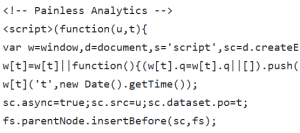
First of all, the analytic service must be easy to implement. This can be broken down into 3 components: A) easy to implement, B) easy to configure, and C) have an all-in-one script. By “implement”, it usually means a simple, small script or tracking code that you’ll need to insert into your webpages. You don’t want it to be too large, because there’s a risk of incorrectly inserting the code, and you want to have clean, unobtrusive code that doesn’t hinder the loading of your pages. The service may make it even easier by offering extra tips for how to add this script for non-developers, or if you’re using WordPress. Also, you shouldn’t have to configure a bunch of settings before getting your tracking code; it should have recommended privacy settings by default. Finally, a simple service would only need a single tracking script — no additional scripts needed for tracking custom events or page performance. Compare that to Google Analytics, which requires additional scripts with Google Tag Manager for tracking custom user interactions.
Second Pillar of Simple Web Analytics: Dashboard Views
The next pillar of a simple web analytics service is the dashboard and user experience. Google Analytics shows you a bunch of information as soon as you log in. Even all the alternatives tend to present you with the same view – visitor counts at the top, big line graph that tracks over time, lists of all the pages tracked, all the countries your users are from, etc. Your eye is immediately drawn to the graph and tries to make sense of it, even though it may be the same traffic you’ve always seen and nothing changed. Your first page shouldn’t have so much noise all at once, but instead show you just the top values that you’re interested in.
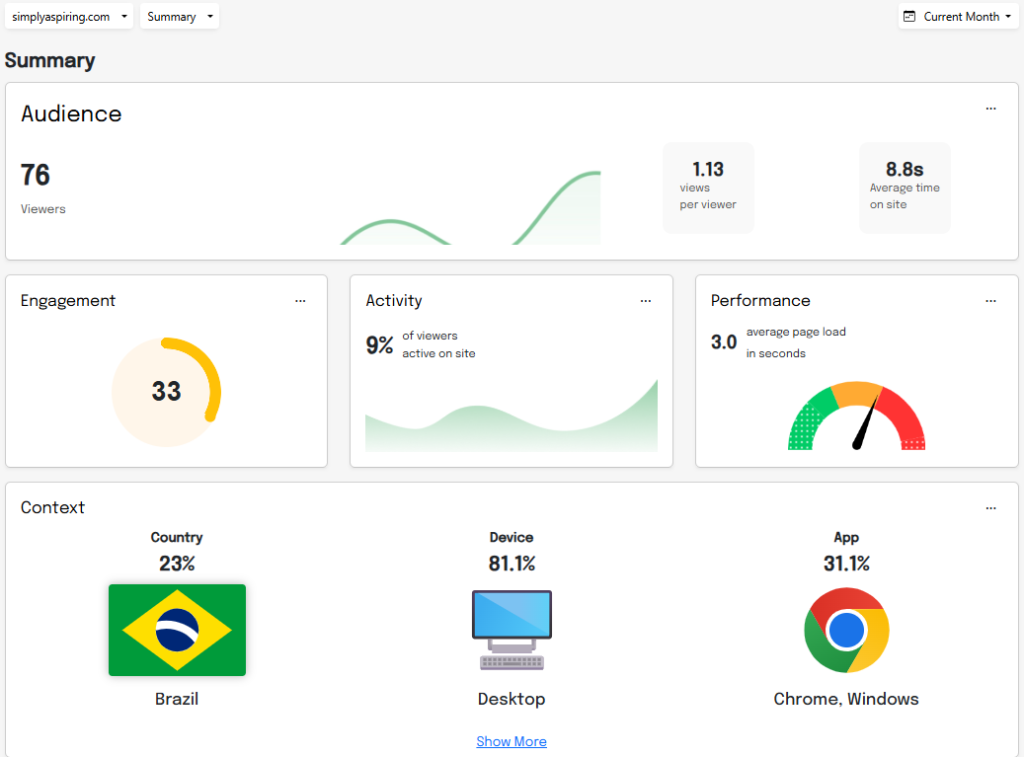
At Painless Analytics we took a different approach, redesigning the dashboard to present data in a fresh new way and focusing on just the top values. You can drill down into the Country, Device, and App values to see the full list. This approach makes it more straightforward and saves time struggling to understand the dashboard.
Third Pillar of Simple Web Analytics: Developer API

The third pillar of a simple web analytics service is the features and simplicity available in the developer tools that allow access to the raw data. Not every customer will be interested in these features, but it’s included here since it is a vital component of an analytics service. With today’s well-deserved focus on security and privacy, developer tools can sometimes be extremely complicated to work with and set up. A developer makes programming calls to an API (Application Programming Interface) in order to retrieve raw data for their account, and it can be time-consuming to understand how to access and use this API, especially around permissions. OAuth2 is a common yet complicated way of authenticating API calls, but there can be other methods. Check in the service’s documentation to get a feel for how easy it will be to work with their API. At Painless Analytics we use RestFUL API access via oAuth2 access tokens, and we can work you for other options as well. We’ll be adding more documentation on how to access our API in the future!
Fourth Pillar of Simple Web Analytics: One-Stop Shop
The last pillar of simple web analytics is being a one-stop shop for many features and tools. Imagine needing completely separate services for website analytics, podcast analytics, monitoring ad campaigns, custom event tracking, accessing raw logs, and page performance! The more fully-featured a service is, the simpler it is for your life and sanity. You’d only have to sign up once and have a single login for all of the features, rather than remembering what service offers what. Now, ideally these services are offered with a simple user experience or website design, rather than just creating a noisy dashboard with everything. Google Analytics requires a separate Tag Manager for custom event tracking, and the Google Lighthouse service for page performance. Painless Analytics strives to include all the critical features you need, including web & podcast analytics, custom event tracking, and page performance out of the box!
Hopefully this article sheds some light into some of the basic pillars or features that a “simple” web analytics service should offer. Let us know in the comments what your experience has been with simple vs complex analytics services!