Once you’ve added your tracking script to your webpages and have allowed some time for the first traffic to be recorded, you can view your dashboard! After logging in, click Analytics Dashboard, then select the website. Choose one of your hostnames, if more than one. You’ll see the Summary page, which looks something like this:
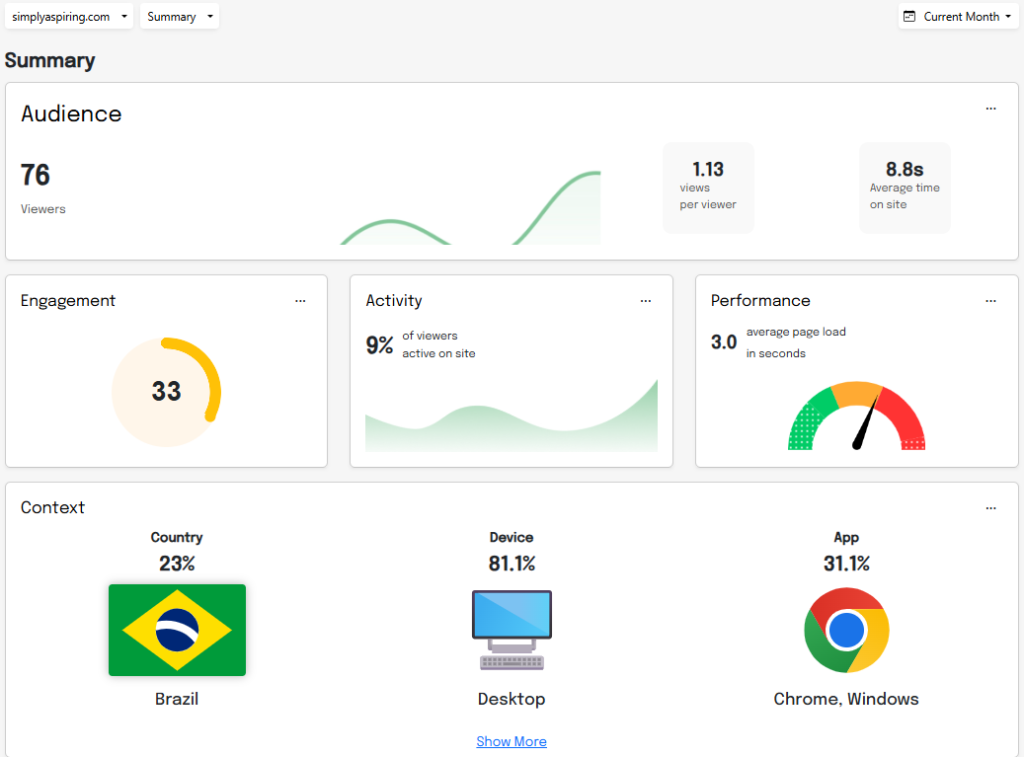
Instead of overwhelming you with everything all at once, we just show you the most important numbers that you are interested in. Many can be drilled down into to find the details.
Audience & Activity
- Viewers — the unique visitors to your site.
- Views per Viewer –the average number of pages viewed per visitor.
- Average time on site — the average time someone spends on your site.
- Engagement — our unique formula for determining how much activity the average visitor is doing on your site. It could be scrolling, clicking, playing videos, etc.
- Activity — the percentage of your visitors who are actually engaging or performing activities.
Performance
A vital piece of information about your website is performance. Performance is very important for improving user experience and preventing people from leaving too soon (bouncing), as well as for SEO (Search engine optimization)! But not a lot of web analytics services offer this out-of-the-box. We display the average page load (first contentful paint or FCP) of your pages, in seconds, along with a nifty gauge that catches your eye. The FCP is the time it takes before any part of the page content renders on the screen. Our gauge is based on the Google recommended values (<1.8, 1.8-3.0, over 3.0) but with 2 additional ratings. Here are our gauge values:
- Great: less than 1.2 seconds
- Good: from 1.2 to 1.8 seconds
- Needs Improvement: 1.8 to 3.0 seconds
- Poor: 3.0 to 4.5 seconds
- Very Poor: over 4.5 seconds
Context
While the Audience, Activity and Engagement metrics describe what’s going on in your site, the context is what we call the statistics that describe your visitors — who they are and how they access your site. We only show the top value in each metric so you can see who your main visitors are. Click the “Show More” link to view the Context page, which shows a more detailed view of your visitor context.
- Country – the country where your visitors are coming from
- Device — the device your visitors use to access the site (desktop vs mobile)
- App – the browser and OS your visitors use to access the site (Chrome vs Edge, etc)
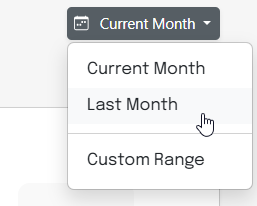
Date Range
The dashboard will only show data from a certain time range at a time. Use the drop-down in the top right corner to change the date range.
Troubleshooting
Check below for specific messages you may see instead of your dashboard, and what they mean.
Sorry, we do not have data to report. It may be too soon to report or the date range specified is before we started collecting data. If you see this message and you just implemented your script, please allow an hour or 2 before checking your metrics.
Time to Implement, let’s start recording web traffic! Please implement the code below so we may start tracking to your website. If you see this message, the tracking code has not been detected on the host name selected. Verify your tracking code was published correctly to your web pages on every page you’d like tracked.
Still having issues, or have any questions about the data you see? Contact us!